You can now track the universal happiness bias, from social media to classic literature
Well, the jig is up. Turns out none of us are actually as happy as we say we are, according to researchers over at the University of Vermont.
A large-scale analysis spanning across ten diverse languages, scanning both online and traditional source material, provides significant evidence for a universal positivity bias in human language. So you can stop posting status updates about how rad your life is. We all know you’re as miserable as the rest of us now.
Researchers have been suspecting our brains erred on the side of positivity since the 70’s, when psychologists Margaret Matlin and David Stang provided substantial evidence supporting the Pollyanna principle. The Pollyanna principle posited that the subconscious mind tends to focus on the more optimistic thoughts. Matlin and Stang’s study affirmed that we often view our memories through rose-tinted glasses, due to the fact that our brains are capable of processing positive events much more precisely than negative ones.
We often view our memories through rose-tinted glasses.
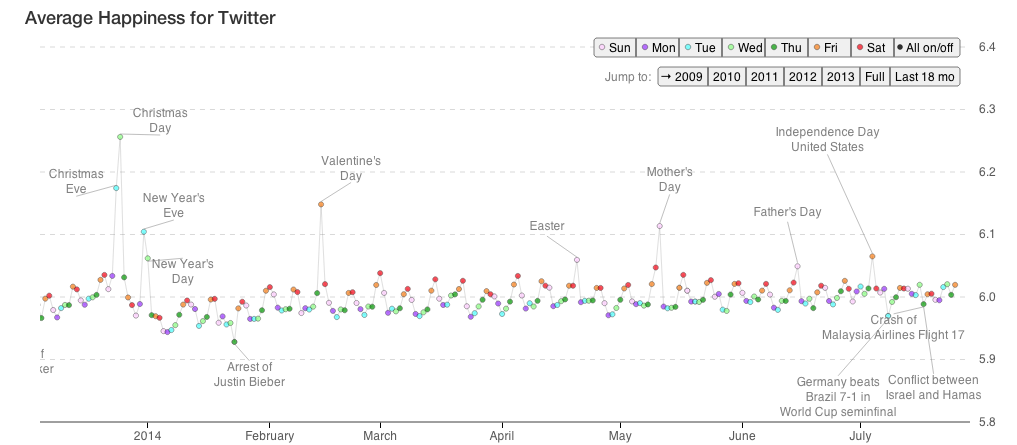
However, truly proving the positivity bias required a more comprehensive and quantifiable approach. In 2009, a team of mathematicians at UVM’s Computational Story Lab banded together to try and measure happiness on a large scale. They had people rate over 5,000 unique and commonly used English words on a happiness ranking from 1-9, before taking to the internet in order to scan for frequency. When Twitter became more popular, the team created the hedonometer, an instrument that tracked online expressions of happiness geographyically and in real time.
Hedonometer’s data pulls from “Twitter’s Grdenhose feed, a random sampling of roughly 50 million (10%) of all messages posted to the service, comprising of 100GB of JSON each day.” The results, while demonstrating a general trend toward positive language, also revealed the Twitterverse’s capacity for complex emotions. After Osama bin Laden’s assassination, for example, their Interactive Wordshit chart demonstrated a drop in the US’s happiness score, showing that “the overall language of the day on Twitter reflected that a very negatively viewed character met a very negative end.”
In their recent blog post, Story Lab also tracked a shift from the events in Ferguson, documenting Missouri’s swift drop in state happiness ranking from 18th to 32nd in the week of August 13th-August 19th. It was the first time they observed such a rapid change in a state’s ranking. The Interactive Wordshift chart from the first day of the events revealed that some of the most commonly used words on Twitter were “tear,” “can’t,” and “cruel.”
The team’s most recent study shifted attention to tracking happiness in twenty-four books ranging in ten different language. Their purpose was to broaden the scope of their data pool, by measuring positivity biases in different languages, across a longer period of time, and from a less exhibitionistic medium than social media. The positivity bias proved consistent across both languages and mediums, cropping up in news articles, music lyrics, and movie subtitles as well as the books. The widespread and cross-cultural consistency of this positivity bias suggests that language, born from our positivity-oriented brains, may inherently lean toward happier communication technologies.
You can explore the hedonometer’s analysis of all twenty-four books in the study, ranging from classics like Oliver Twist to whatever you’d call a title like Home Taxidermy for Pleasure and Profit. They’ve even implemented a chart that realizes an old Kurt Vonnegut theory, on visualizing the shapes of stories using a computer.